AI Layer Gross Margin is the margin on your variable AI revenue alone — what’s left after inference, GPU compute, vector database, and human-in-the-loop costs. It’s the AI SaaS gross margin your blended company number hides. The average AI-native company reported a 52% blended gross margin in 2026, but the isolated AI layer underneath often runs near a third. Below ~40%, growth makes the hole deeper, not shallower.
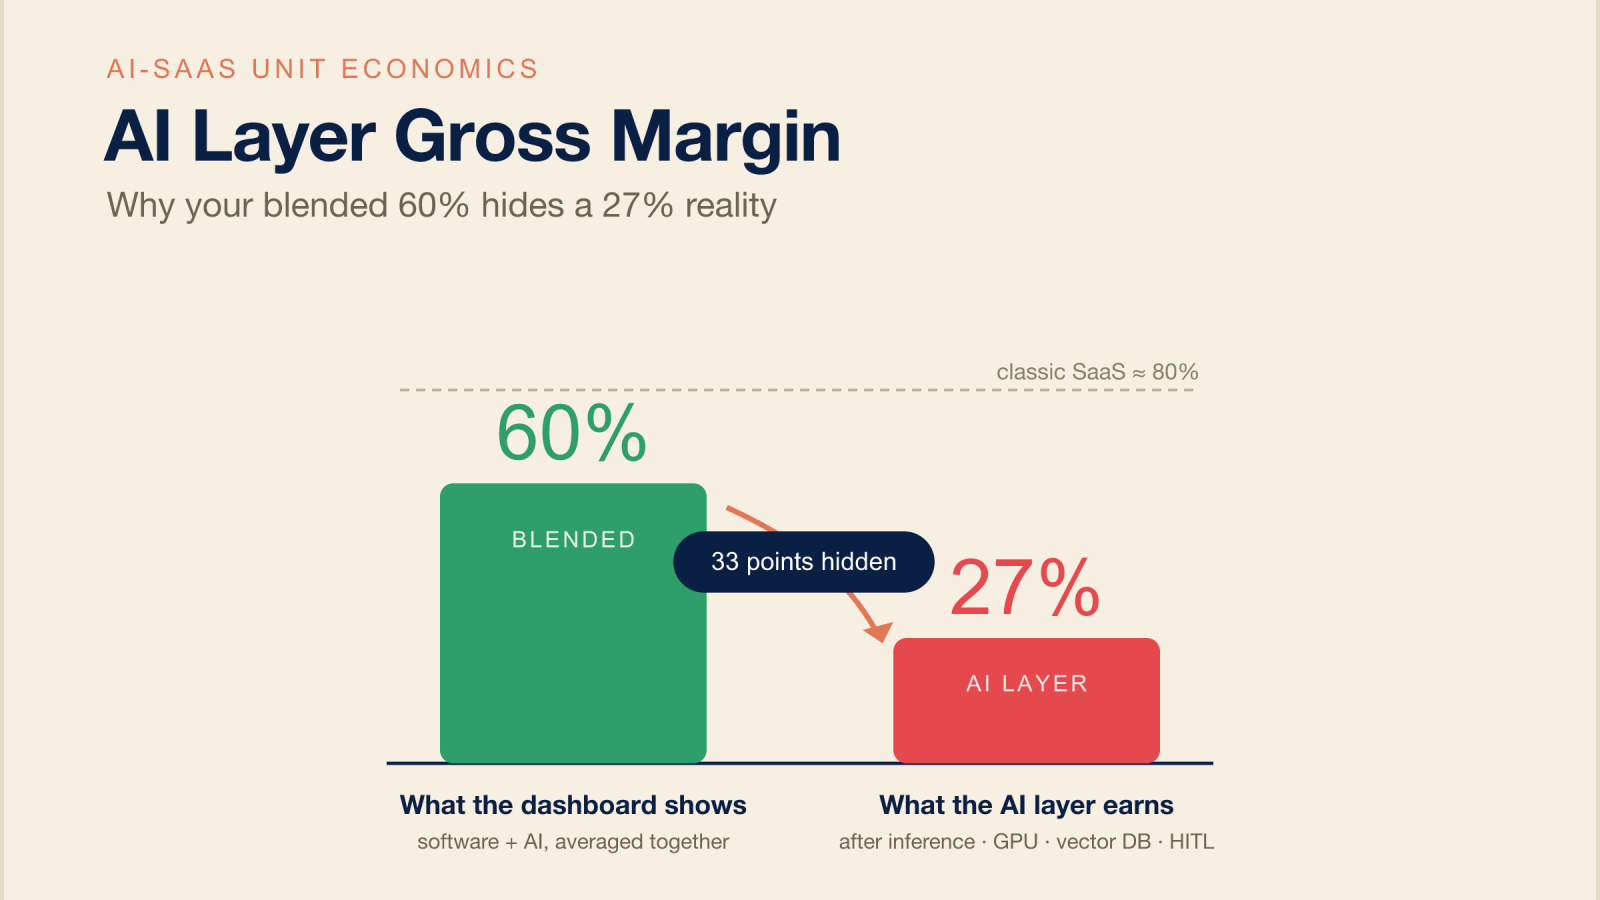
Most founders track one number called “gross margin.” In an AI business, that single number is an alibi. It averages a healthy software layer together with a bleeding AI layer and reports the blend as if it were the truth.
The blended figure is the photograph. The AI layer is the X-ray — and the X-ray is where companies that look healthy turn out not to be.
This article defines the metric, shows you how to compute your own AI SaaS gross margin at the layer level, and explains why a blended margin that looks fine is exactly the condition under which AI startups die at the peak.
If you want the number before the theory, the free AI Gross Margin Calculator computes it directly.
What “AI Layer Gross Margin” actually means — and why blended hides it
AI Layer Gross Margin isolates the economics of the part of your product that burns compute on every use:
In one line: AI Layer Gross Margin is the gross margin of the AI-powered part of a SaaS product after its variable production costs — inference, GPU/compute, vector database, and human-in-the-loop review — are subtracted from the AI-attributable revenue. It tells you whether AI usage funds growth or quietly drains it.
Classic SaaS had near-zero marginal cost: build once, serve infinitely, and business gravity pulled margins toward 80–90%. An AI feature behaves like an energy company instead — every query burns fuel at a market price you don’t set. So your business now has two gross margins living inside one P&L: a software layer that still behaves like SaaS, and an AI layer that behaves like manufacturing.
Report them together and the software layer subsidizes the AI layer right up until the AI layer is large enough to drown it. That’s the trap, and you can see it in the data. Bessemer’s State of AI 2025 split AI companies into cohorts: its “Supernovas” run at roughly 25% gross margins on unoptimized infrastructure and experimental pricing, while its “Shooting Stars” reach roughly 60% after custom models and disciplined pricing.
A single industry-average “AI gross margin” number can’t survive that spread. The average is not your number. Every page currently ranking for “AI gross margin” reports the blend. Almost none isolate the layer. That gap is the whole point.
Why your blended 60% is lying: a worked example
Take a company doing $100 of revenue, split across two layers.
| Line | Software layer | AI layer | Blended |
|---|---|---|---|
| Revenue | $60 | $40 | $100 |
| Inference | — | $19 | $19 |
| GPU / compute | — | $4 | $4 |
| Vector DB | — | $2 | $2 |
| Human-in-the-loop | — | $4 | $4 |
| Hosting / support | $12 | — | $12 |
| Gross profit | $48 | $11 | $59 |
| Gross margin | 80% | ~27% | ~59% |
The blended margin reads ~60% — comfortably “fine.” But the AI layer is running at 27%, and it’s the layer that scales with usage. The healthy software margin isn’t protecting you. It’s hiding the meter.
One clarification so these numbers don’t blur together — three figures, three different denominators:
The discipline is to always know which number you’re quoting.
Where the AI layer’s margin goes: four COGS lines nobody books
When founders can’t find their missing margin, it’s usually because these four costs are scattered across the P&L — some buried in R&D, some called “infrastructure,” some hidden in headcount. They belong in cost of revenue.
Inference is the dominant line. For a vertical-SaaS product where AI is core to the workflow, SFAI Labs puts inference at 3–8% of revenue at scale; for AI-native products the band is wider — 8–12% for chat-shaped products and 14–22% for agent and reasoning-heavy ones.
The accounting isn’t a matter of taste. SFAI Labs argues that under both ASC 606 and IFRS 15, production inference is cost of revenue, not OpEx — and the same logic pulls the eval-engineering function into COGS too. There’s academic support for treating inference as a true variable cost: a 2025 paper, Beyond Benchmarks: The Economics of AI Inference (Zhuang et al.), models inference as a compute-driven production activity with diminishing marginal cost — the cost structure of a factory, not of shrink-wrapped software.
The real 2026 benchmarks — and the 23% everyone misquotes
Here’s the anchor: ICONIQ Capital’s State of AI 2026 reports AI-native gross margins climbing from 41% in 2024 to 45% in 2025 to a projected 52% in 2026 — improving, but with a ceiling well under the 80–90% that defined the SaaS decade.
You’ll see “inference is 23% of revenue” repeated across dozens of pages. It’s a misquote. The only source carrying ICONIQ’s actual attribution block — Vista Equity Partners, citing the 202-leader survey — states inference rises to 23% of total AI product cost, not of revenue. Different denominators, very different numbers — and an entire corner of the internet copied the wrong one.
This isn’t a rare-edge problem, either. Cloud Capital’s Q4 2025 CFO survey found 89% of CFOs reported that rising compute costs hurt gross margin over the prior twelve months. Margin compression from the AI layer is now the base case, not the exception.
Why this kills you at the peak, not the bottom
Classic startups died at the bottom — no demand, no users, runway gone. AI startups increasingly die at the peak, with every dashboard green, because the thing draining them is the growth. As a16z’s Martin Casado has framed it, the “business gravity” that pulled software toward 70–80% margins breaks under AI, because every query reruns the model and re-incurs the cost. Treat that as a useful lens, not a measured fact — the measured fact is Cloud Capital’s 89%.
The pattern founders describe in their own words is “unbounded COGS” — flat pricing meeting variable inference, where one heavy account can quietly eat the margin of ten light ones. A flat seat price doesn’t cancel AI economics. It just hides them from you until a usage spike makes them impossible to ignore.
How to calculate your own AI Layer Gross Margin
You don’t need a new system. You need to stop averaging. Run this:
- Isolate variable AI revenue. Separate revenue tied to AI usage from fixed subscription revenue. If pricing is bundled, allocate by usage.
- Strip the four COGS lines. Subtract inference, GPU/compute, vector DB, and HITL — pulling each out of wherever it hides in R&D, infra, or headcount.
- Apply a Variance Buffer. Multiply variable AI costs by ~1.2× to stress for token-price swings and retry spikes. A model that assumes inference never gets pricier has never met a bad agent loop.
- Read it against the bands. Below ~30% is a structural problem; 30–40% is weak; 40–50% is healthy; 50%+ is top-tier.
Knowing the number is step one. The next step is to build it into a full AI startup financial model — scenarios, burn, runway, and investor metrics built around the same margin.
How to improve a low AI Layer Gross Margin
A 27% layer isn’t a verdict — it’s a worklist. The levers fall into three groups: spend less per call, charge in line with the meter, and stop the few accounts that distort the average.
Spend less per call
- Model routing. Send easy requests to a small, cheap model and reserve the frontier model for the hard ones — usually the single biggest lever, and what pulled Cursor’s economics back from a deeply negative layer.
- Caching. Cache embeddings, retrievals, and repeated completions; a high cache-hit rate turns a variable cost into a near-fixed one.
- Context discipline. Every token in the prompt is paid for on every call — trim system prompts, retrieved chunks, and conversation history.
- Async & batching. Route non-interactive work to cheaper batch/throughput tiers instead of paying real-time rates.
- Confidence-gated HITL. Replace blanket human review with eval automation and review only the low-confidence outputs — the largest hidden COGS line is often people, not tokens.
Charge in line with the meter
- Usage-based or tiered pricing. Flat per-seat pricing against variable inference is the structural trap; tie price to the cost driver.
- Usage caps & fair-use limits. Bound the cost per account so one outlier can’t eat the margin of ten paying customers.
Watch the layer, not the blend
- Per-customer AI Layer GM. Report the layer margin per account, not just company-wide — heavy-user concentration shows up here long before it reaches the P&L.
Test which lever actually moves your number with the free AI Gross Margin Calculator, or model all of them across twelve months in the AI SaaS financial model template.
FAQ
What is a good AI layer gross margin?
Is inference cost COGS or OpEx?
Why are AI gross margins lower than SaaS?
Does flat pricing fix AI margins?
Is “23% of revenue” the right inference benchmark?
Inference keeps getting cheaper — won’t margins fix themselves?
Sources & benchmark notes
Every external figure above is linked at the point it’s used; the table collects them with their original denominators — because the wrong denominator is exactly how the “23%” number got mangled across the web.
| Claim | Source | Denominator | Note |
|---|---|---|---|
| AI-native GM 41% → 45% → 52% | ICONIQ, 2026 | blended GM | 2024–26; 2026 projected |
| Supernovas ~25% / Shooting Stars ~60% | Bessemer, 2025 | gross margin | cohorts: unoptimized vs optimized |
| Inference 3–8% vertical / 8–22% native | SFAI Labs, 2026 | % of revenue | varies by product shape |
| Inference belongs in COGS | SFAI Labs, 2026 | ASC 606 / IFRS 15 | production inference = cost of revenue |
| “23%” is product cost, not revenue | Vista (citing ICONIQ), 2026 | AI product cost | widely misquoted as % of revenue |
| 89% of CFOs: compute hurt GM | Cloud Capital, 2025 | CFO survey | prior 12 months |
| Price/perf falling ~5–10×/yr | arXiv 2511.23455, 2026 | fixed performance level | unit price, not total spend |
| Inference as compute-driven production | arXiv 2510.26136, 2025 | academic model | diminishing marginal cost |
| Stability AI ~$11M rev vs ~$99M cost | Forbes, 2023 | revenue vs compute/opex | reported internal figures |
| Cursor ~$650M to Anthropic vs ~$500M rev | reported, 2025 | cost vs revenue | before model routing |
How the data was gathered: benchmarks are drawn from named public sources (ICONIQ, Bessemer, Vista Equity, Cloud Capital, SFAI Labs, arXiv) and cross-checked against first-hand fractional-CFO observation; practitioner thresholds are labeled as such. The frameworks here are teaching tools, not forecasts or financial advice. Published June 2026.
What to do next
Reading isn’t doing. Three options, in ascending order of investment: